
Four industries. One fleet that delivers, inspects and maps.
The same autonomous aircraft fly spare parts and tools to remote sites and collect inspection and survey data. Here is what that looks like in each industry we serve.
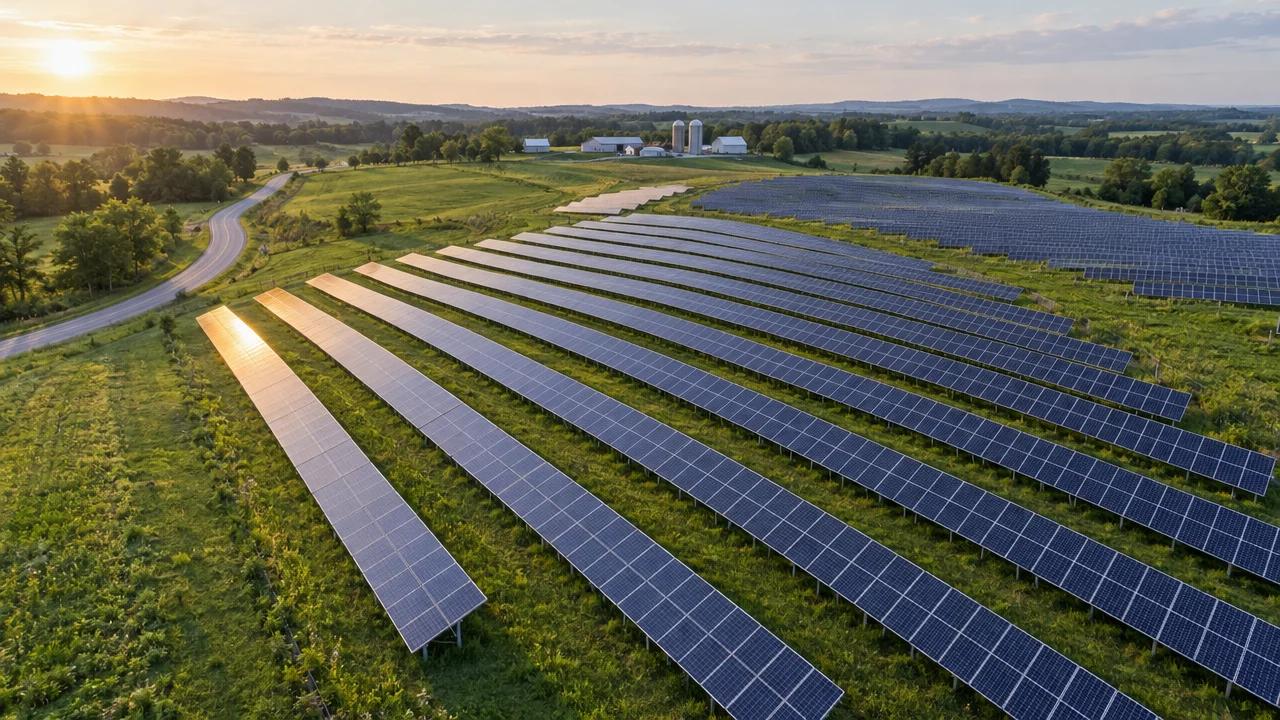
- Solar farms
- Power lines
- Pipelines
- Substations
Solar farms, power lines and pipelines stretch across thousands of acres that ground crews can't walk every week.
Dronavid flies scheduled visual and thermal patrols, maps every hotspot and defect to a coordinate, and flies spare parts out to remote sites.
- Sensors
- RGB + Thermal
- Range (km)
- 40
- Payload (kg)
- 5
- Output
- Hotspot map
- Schedule
- Routine / on-call
- Data
- GIS-ready
Energy
At utility scale, thermal drones are replacing handheld solar inspections: one flight now covers work that used to take a crew several hours.
Solar farms, power lines and pipelines stretch across thousands of acres that ground crews can't walk every week.
Dronavid flies scheduled visual and thermal patrols, maps every hotspot and defect to a coordinate, and flies spare parts out to remote sites.
Solar thermal sweeps
Grid-pattern thermal flights over the array flag failed cells, bypassed diodes and soiling, each tied to a row and panel.
Line & pipeline patrols
Corridor flights check towers, insulators, right-of-way vegetation and pipeline encroachment without a helicopter booking.
Remote parts delivery
Fuses, sensors and tools fly out to substations and well pads, so a missing part doesn't keep a crew waiting.
- Geo-tagged thermal and visual imagery
- Defect register ranked by severity
- GIS layers for your asset system
- Repeat flights on the same path to track change
Infrastructure
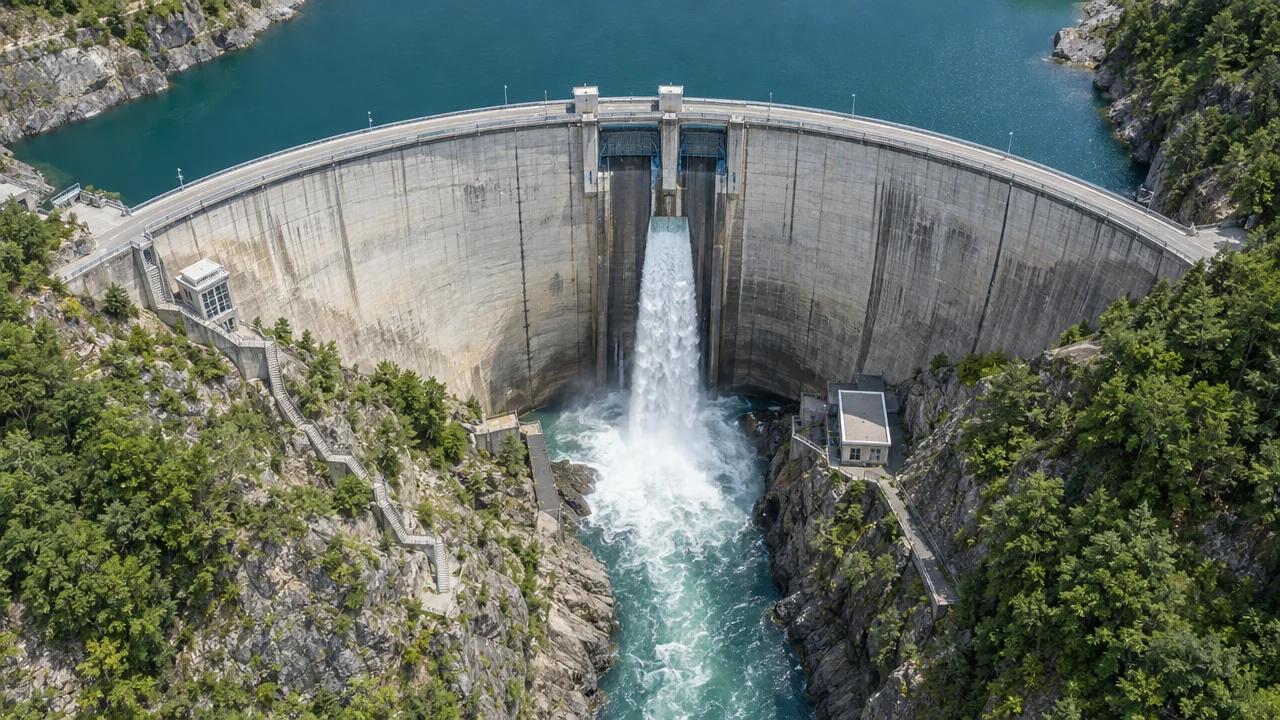
In a 39-bridge study, replacing traditional access such as snooper trucks, rope access and scaffolding with drones cut inspection costs by 40% on average.
Dams, bridges, roads, rail and towers need regular close inspection, and doing it with rope teams, lifts and lane closures is slow, costly and risky.
Dronavid images structures up close, builds 3D models, and logs every defect against the last flight, so engineers can see exactly what has changed.
Dam & bridge inspection
Close-range imagery of faces, spillways, cables and bearings, compared flight to flight so cracks and spalling are tracked over time.
Road & rail corridors
Corridors are flown on a schedule and after storms or incidents, so crews know where to go before they leave the depot.
Towers & tall structures
Telecom masts, chimneys and towers are inspected without a climb, with every bolt, antenna and weld photographed in detail.
- Inspection-grade imagery and 3D models
- Defect log with the location of every finding
- Side-by-side comparison with previous inspections
- Report formatted for your engineering review
Industry
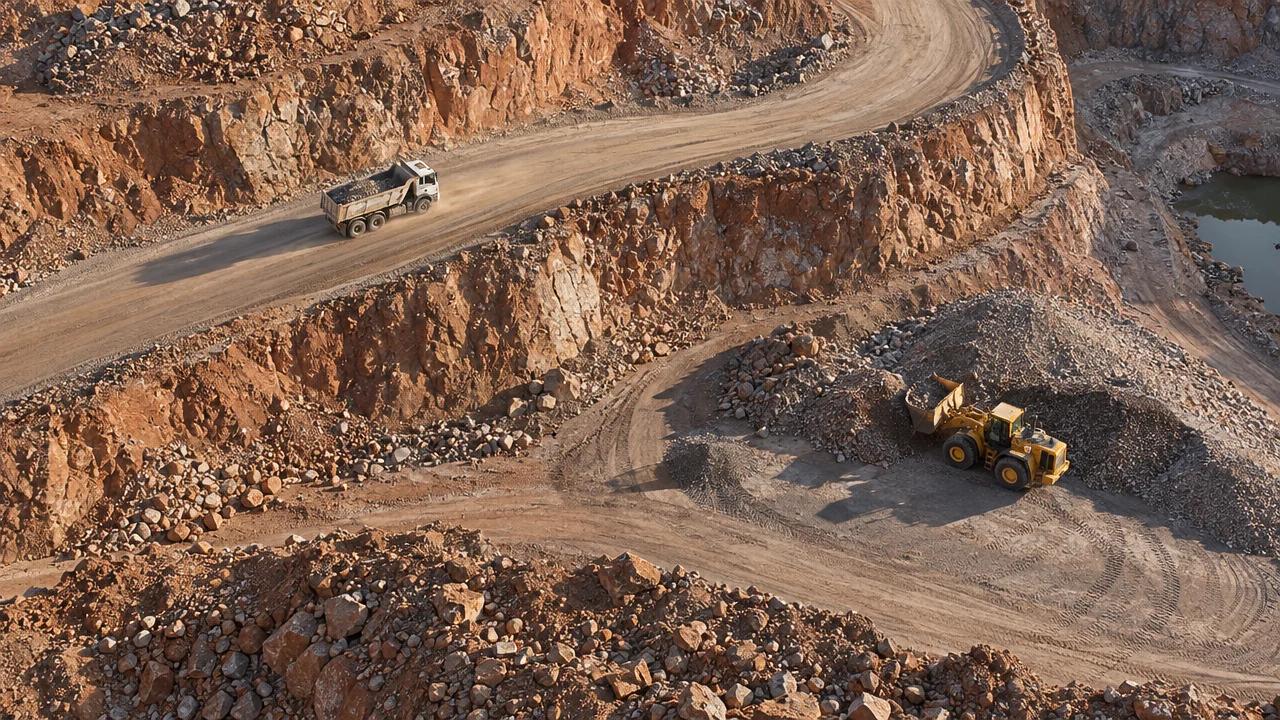
Independent quarry and gravel trials put drone stockpile volumes within about 1–3% of conventional ground surveys when good ground control is used.
Quarries, mines and large sites need stockpile, pit wall and haul road data that is slow and risky to collect on foot.
One Dronavid survey flight replaces hours of walking with a total station, and the same fleet runs parts and tools across the site on demand.
Stockpile volumes
Regular flights measure every pile on site, so month-end inventory comes from data, not estimates.
Pit wall & haul road monitoring
Repeat surveys show bench movement, ramp condition and drainage before they become a safety problem.
On-site parts runs
Parts, tools and documents move between workshops, pits and offices in minutes instead of a vehicle round-trip.
- Stockpile volume report per pile
- Orthomosaic and elevation model of the site
- Cut / fill and change maps between surveys
- Exports for your mine planning or CAD software
Geospatial
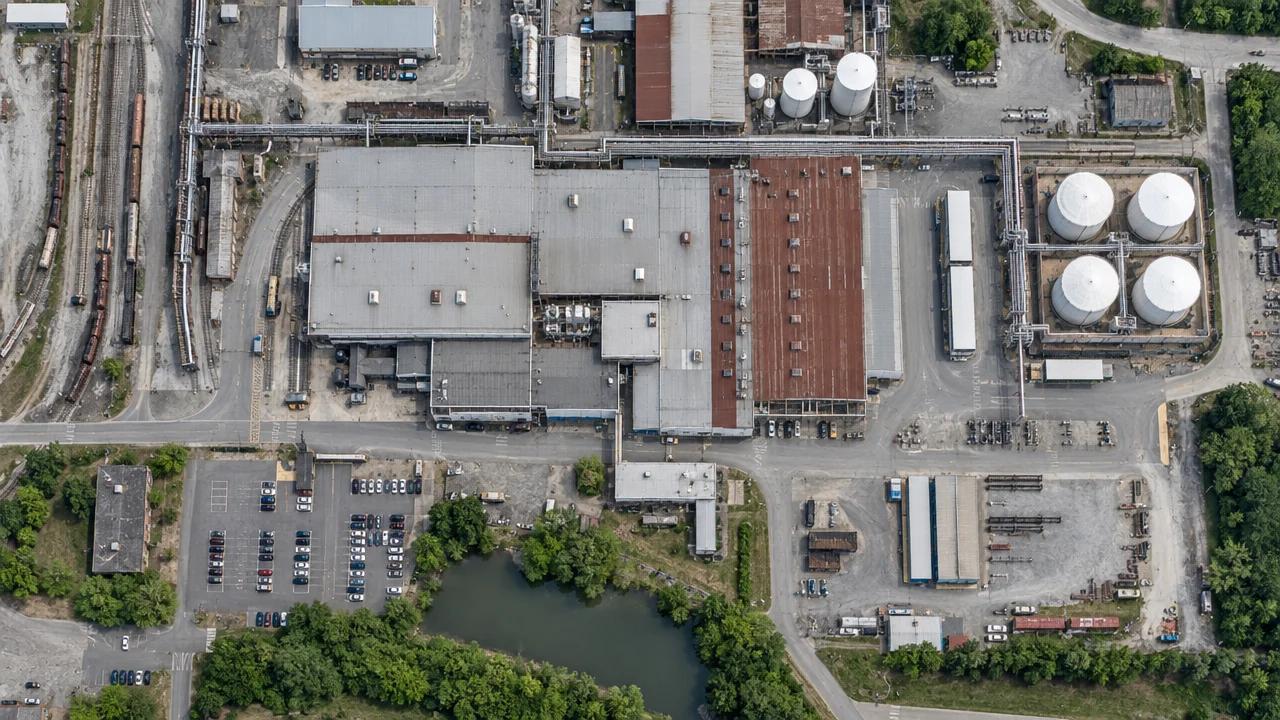
With RTK or PPK positioning and a few well-placed ground control points, drone surveys routinely reach 2–5 cm accuracy, confirmed against independent checkpoints.
Planners, engineers and site managers need current, high-resolution maps, not satellite images from months ago.
Dronavid flies survey missions with RTK or PPK positioning and delivers orthomosaics, elevation models and digital twins of whole sites, checked against ground control.
Mapping & land survey
Orthomosaics and elevation models for planning, land records and engineering design, delivered in your coordinate system.
Digital twins
3D models of industrial parks, campuses and facilities that teams can measure, annotate and compare over time.
Flood & environmental mapping
Drainage, erosion and flood-risk mapping flown on a repeat schedule, plus rapid imagery after a storm.
- Orthomosaic (GeoTIFF) and elevation models
- Point cloud (LAS) and textured 3D mesh
- Accuracy report against independent checkpoints
- Data in your coordinate system and datum